TL;DR: Rolling out Claude Code to a team is easy. Running it is not: leads want to see where tokens go, stop a runaway session, cap spend per person and know what failed CI runs cost. The admin console gives you seats and a monitoring page, but the monitoring page does not cover Claude Code, and nothing in it can stop an agent. I built kame, a small control plane on a single Cloudflare Worker: it receives Claude Code’s OpenTelemetry metrics, shows five dashboards, and enforces an org-wide off switch and daily token caps through a plugin that every seat loads from managed settings. Its token totals matched the CLI’s own count with 0% difference, the off switch stops new prompts in about 1.3 seconds, and CI failure numbers matched GitHub on 9 of 9 repositories. The hard part was not the dashboard. It was the four rollout gotchas and one honest limit at the end of this post.
The brief
The ask came from an engineering org moving its developers onto AI coding agents. Stripped down, it was seven controls:
- Token visibility per developer, per model, per kind of work.
- A daily token cap per person.
- Spend alerts before a cap is hit, not after.
- A central off switch that pauses every agent at once.
- A routing guard: stop agents from pulling huge files into context when a subagent or a partial read would do.
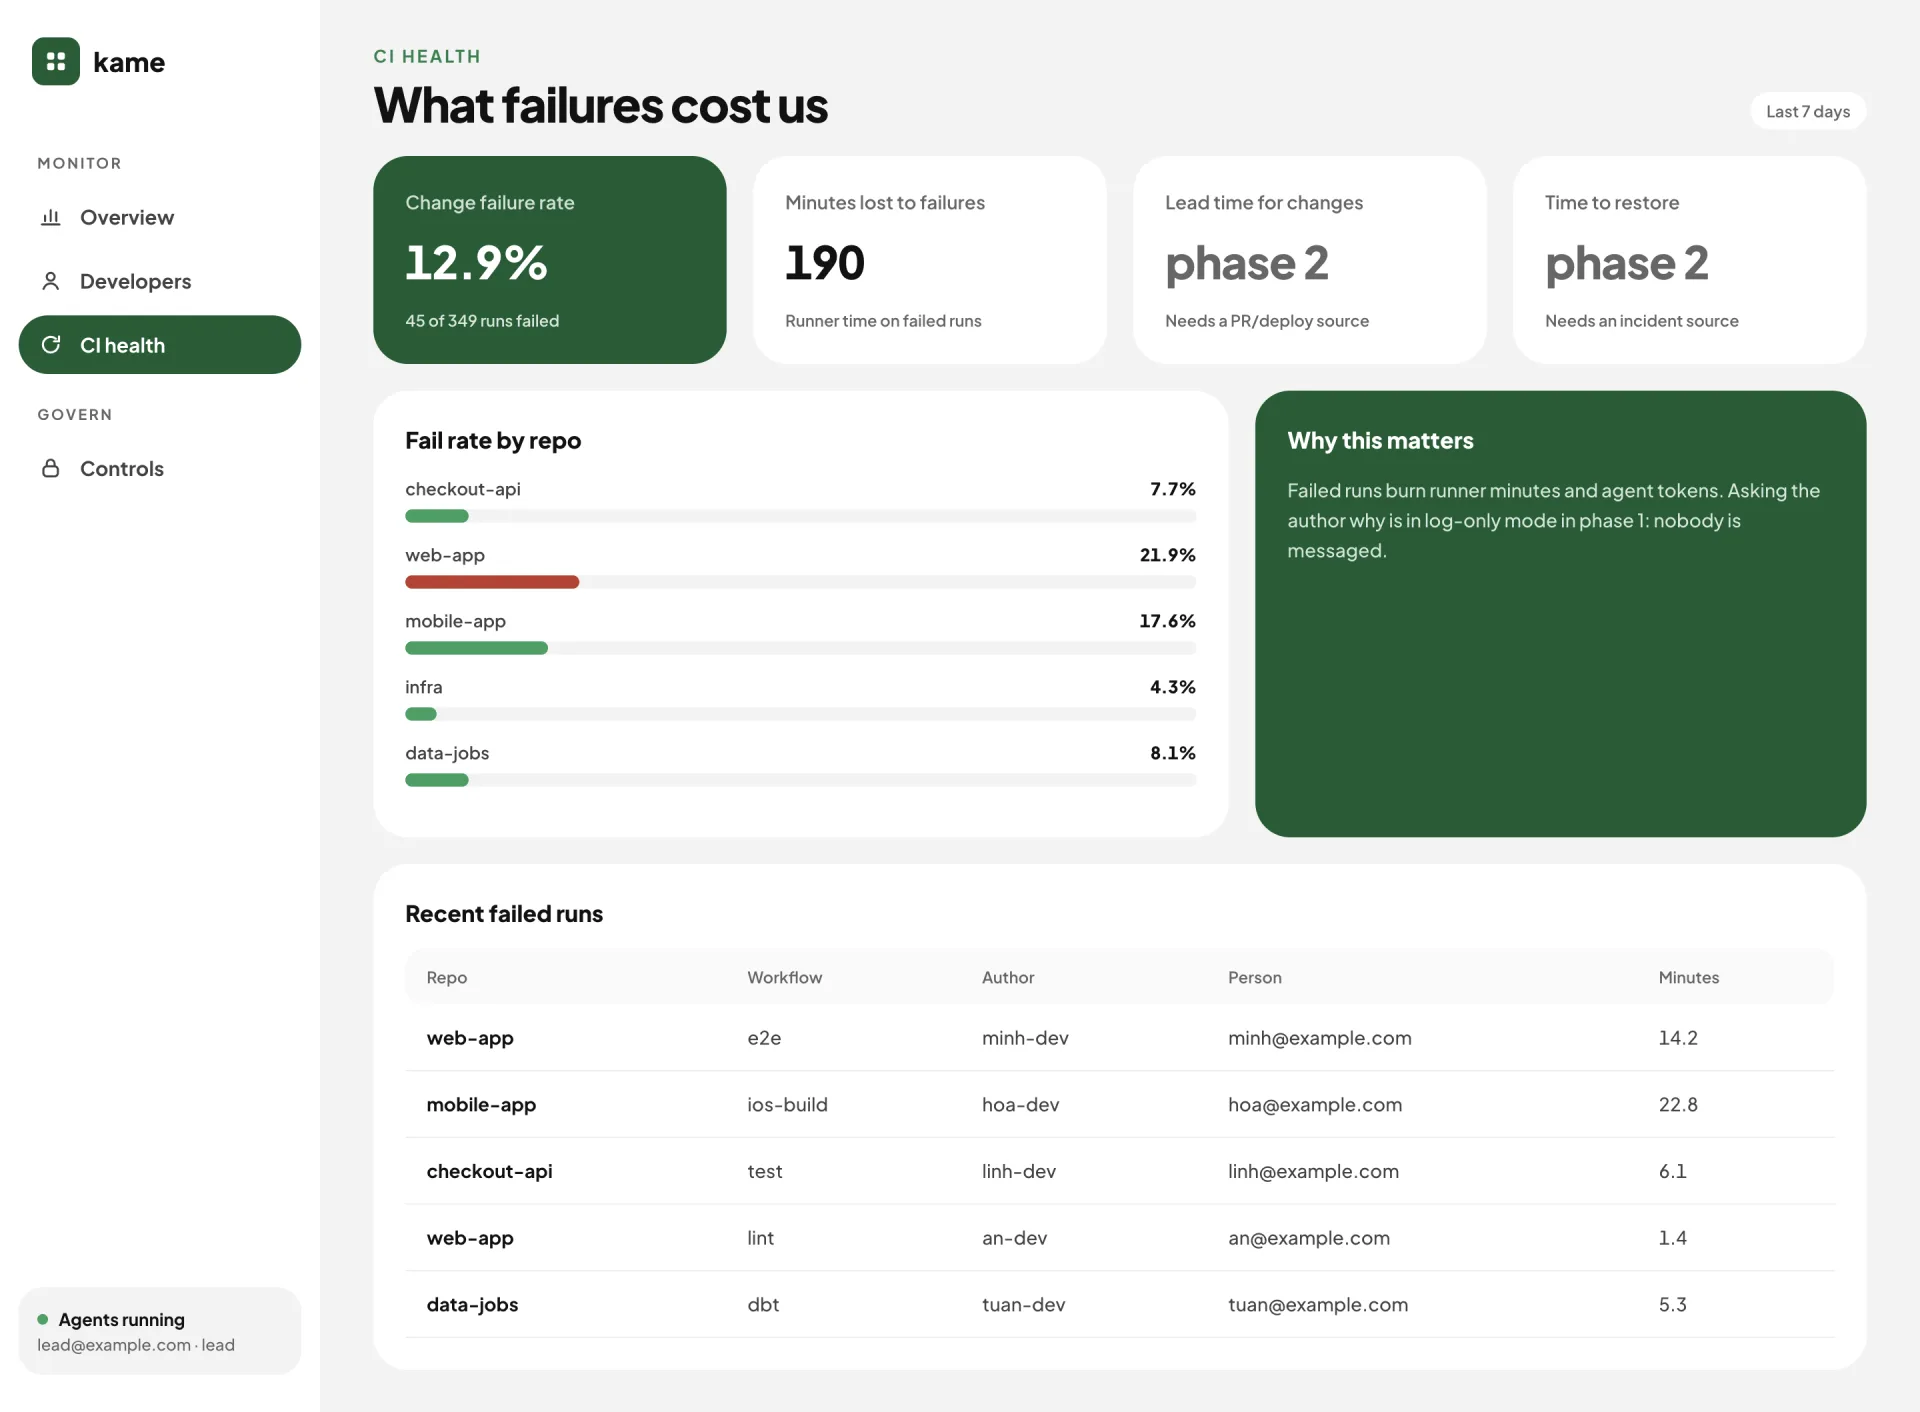
- CI failure cost: how many runs fail, and how many runner minutes that burns.
- KPIs per developer, without turning into a surveillance tool.
Before building anything, I wanted to know how much of this the vendor already covers.
What the console covers, and what it does not
The admin console has a Monitoring page with OpenTelemetry settings. It looks like the answer. It is not: that page configures telemetry for Cowork and the Office agents only. Claude Code telemetry is configured somewhere else, through the env block of the org’s managed settings, which every signed-in seat downloads.
That route works, with details you only find by testing:
- Temporality must be cumulative. With delta temporality my backend received resource metadata and no usable counters.
- Headless runs read a stale cache.
claude -pand CI start the exporter before fresh managed settings arrive, so a change of endpoint silently goes to the old one. The settingforceRemoteSettingsRefresh: truefixes it. - Telemetry answers “how much”, never “stop”. There is no switch, no cap and no alert in the console for Claude Code usage per person.
So controls 1 and 6 need a place to land the data, and controls 2 to 5 need something that can act inside a developer’s session.
Where to put the data
I tried three backends against the same metrics.
| Option | Result |
|---|---|
| Grafana Cloud (hosted) | Works well and was the fastest to a first dashboard. Right answer for a team that already runs Grafana. Cannot act on anything. |
| Self-hosted Grafana/OTel stack on a small VM | The smallest cloud VM ran out of memory under the all-in-one image. Viable only on a bigger box someone has to patch. |
| Cloudflare Worker + Analytics Engine + KV | No server to run, sits behind the same SSO as other internal tools, and the Worker can also answer the agents. Chosen. |
The last point decided it. A dashboard alone covers two of the seven controls. A Worker that stores the metrics and exposes a small API can serve the other five as well.
What kame is
All screenshots in this post use demo data for a fictional team. The numbers in the tables come from the real pilot.
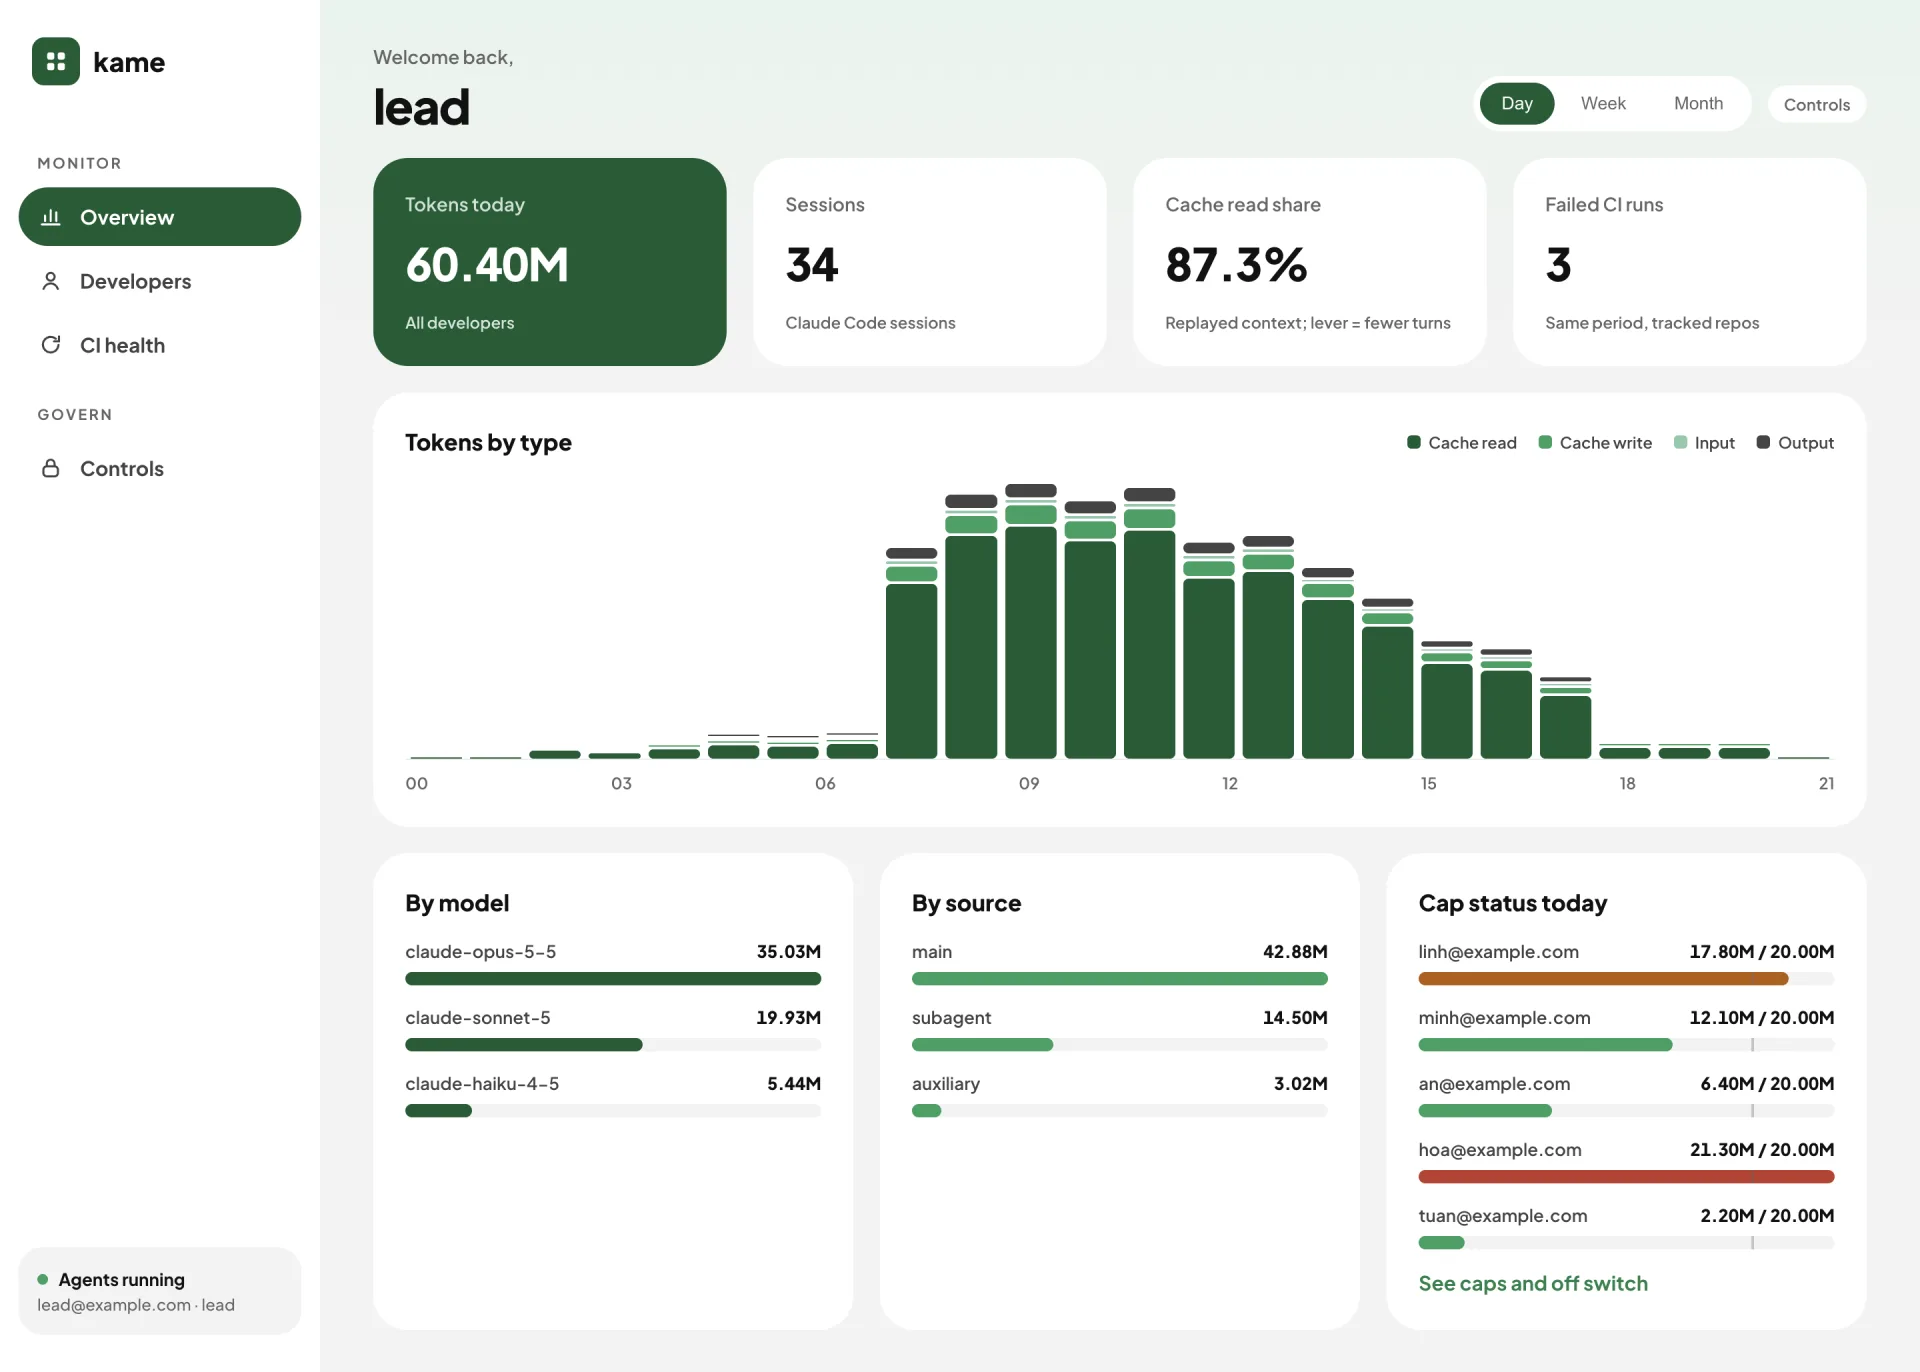
- Ingest. Claude Code exports OTLP/HTTP JSON to the Worker with a bearer token. Every series (person, session, token type, model, source) is written to Analytics Engine with its own index, so one heavy user cannot push a light user out of the sample.
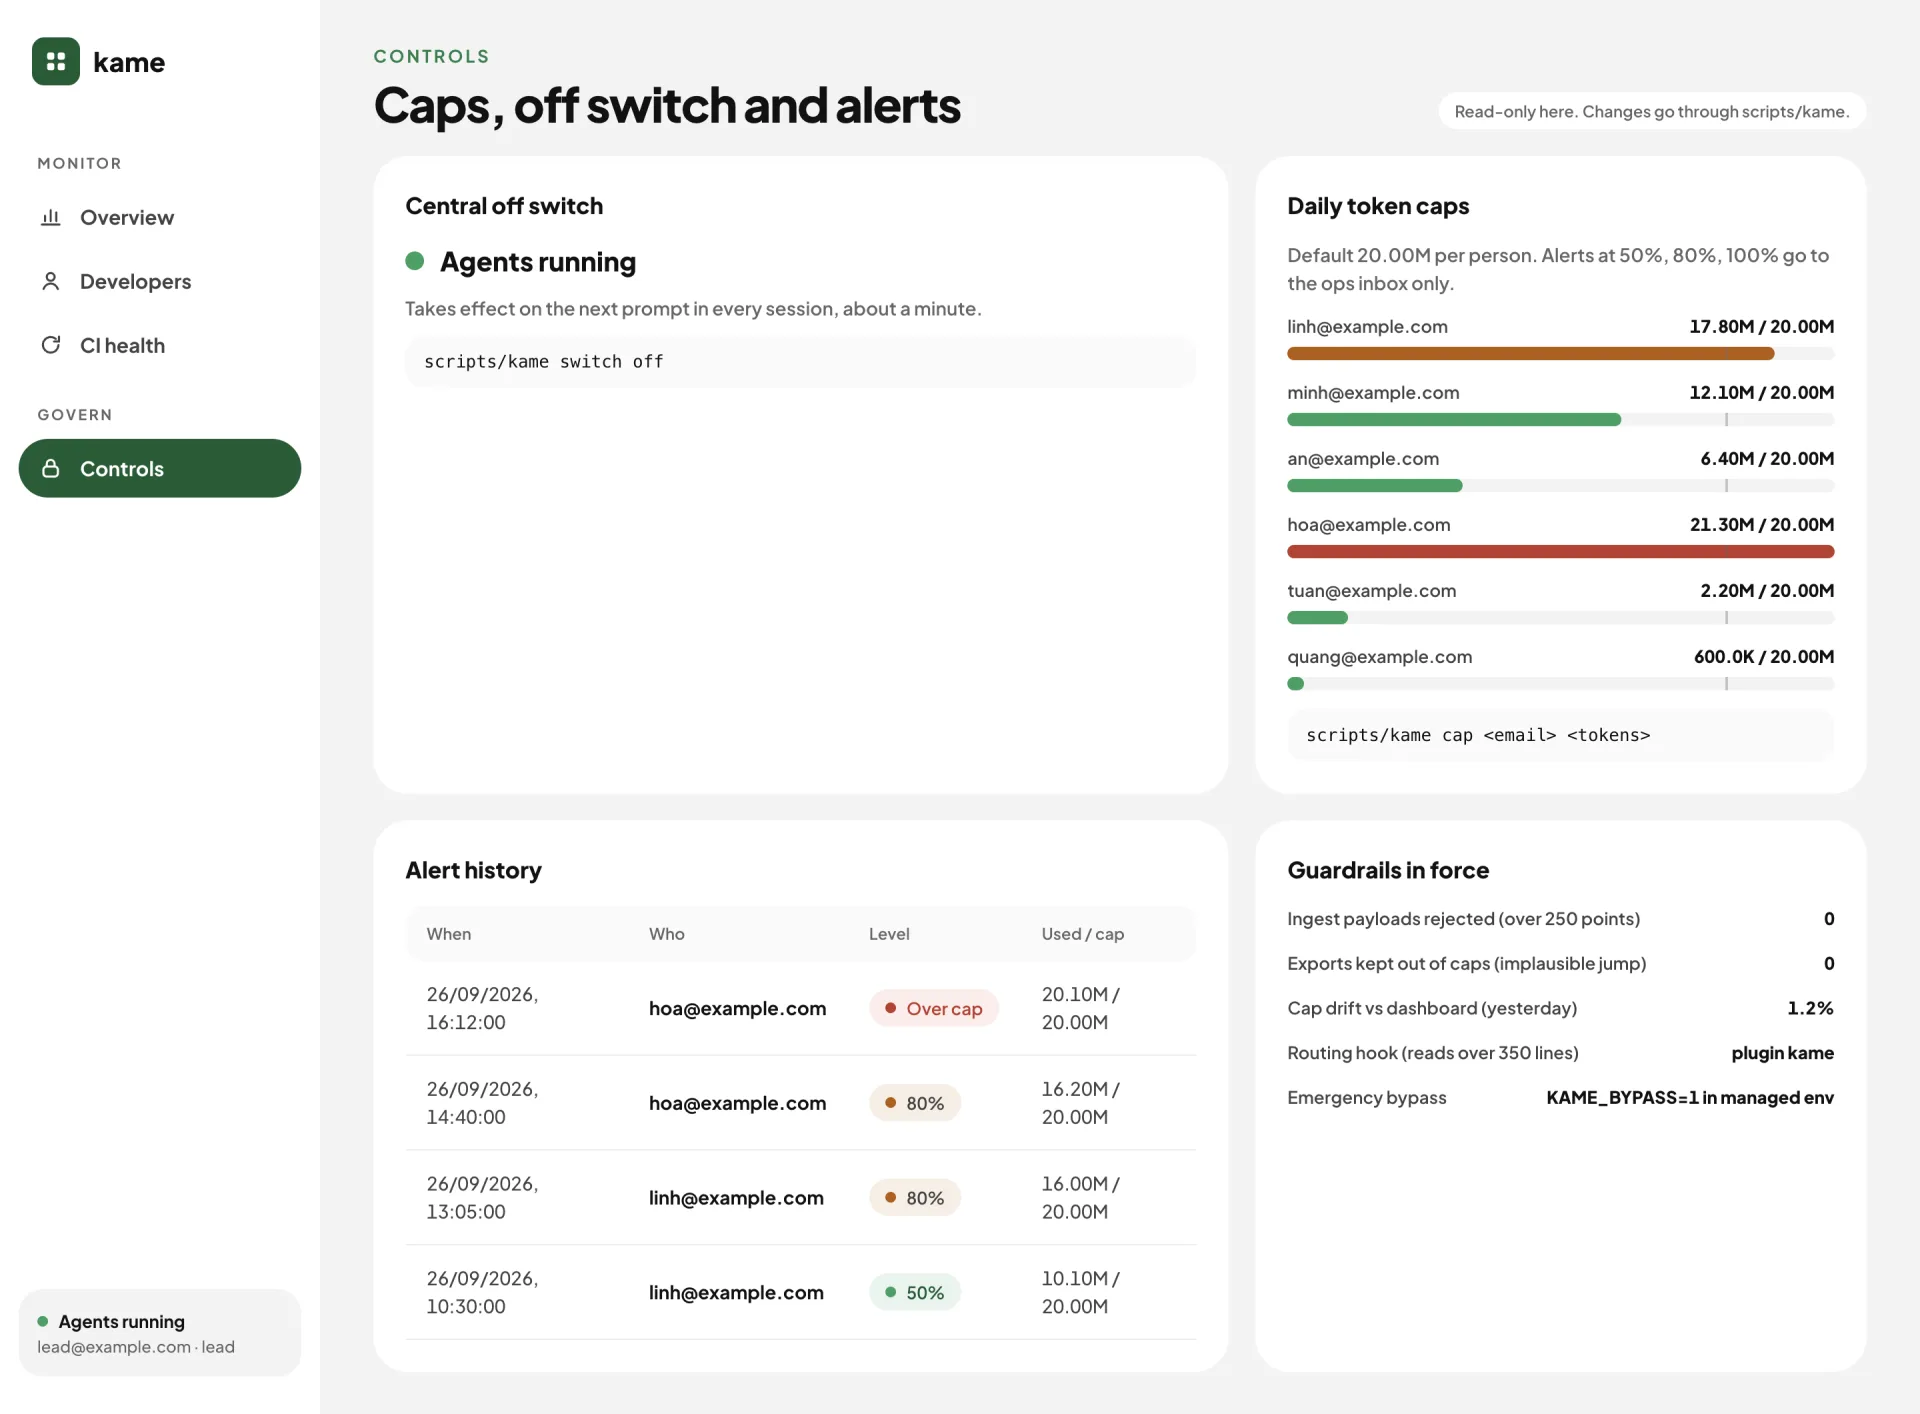
- Dashboards. Five screens behind Cloudflare Access: Overview, Developers, Developer detail, CI health and Controls. The server filters by the signed-in identity: leads see everyone, each developer sees only their own row.
- Enforcement. A Claude Code plugin with two hooks, force-installed through managed settings. Before every prompt and every tool call it asks the Worker two questions with a read-only service token: is the org switch on? and is this person over today’s cap? A third hook blocks a whole-file read over 350 lines and suggests a partial read or a subagent.
- Alerts and CI. Cron jobs mail the ops inbox at 50, 80 and 100% of a person’s cap, and read GitHub Actions runs with a fine-grained token that can read Actions on the listed repositories and nothing else.
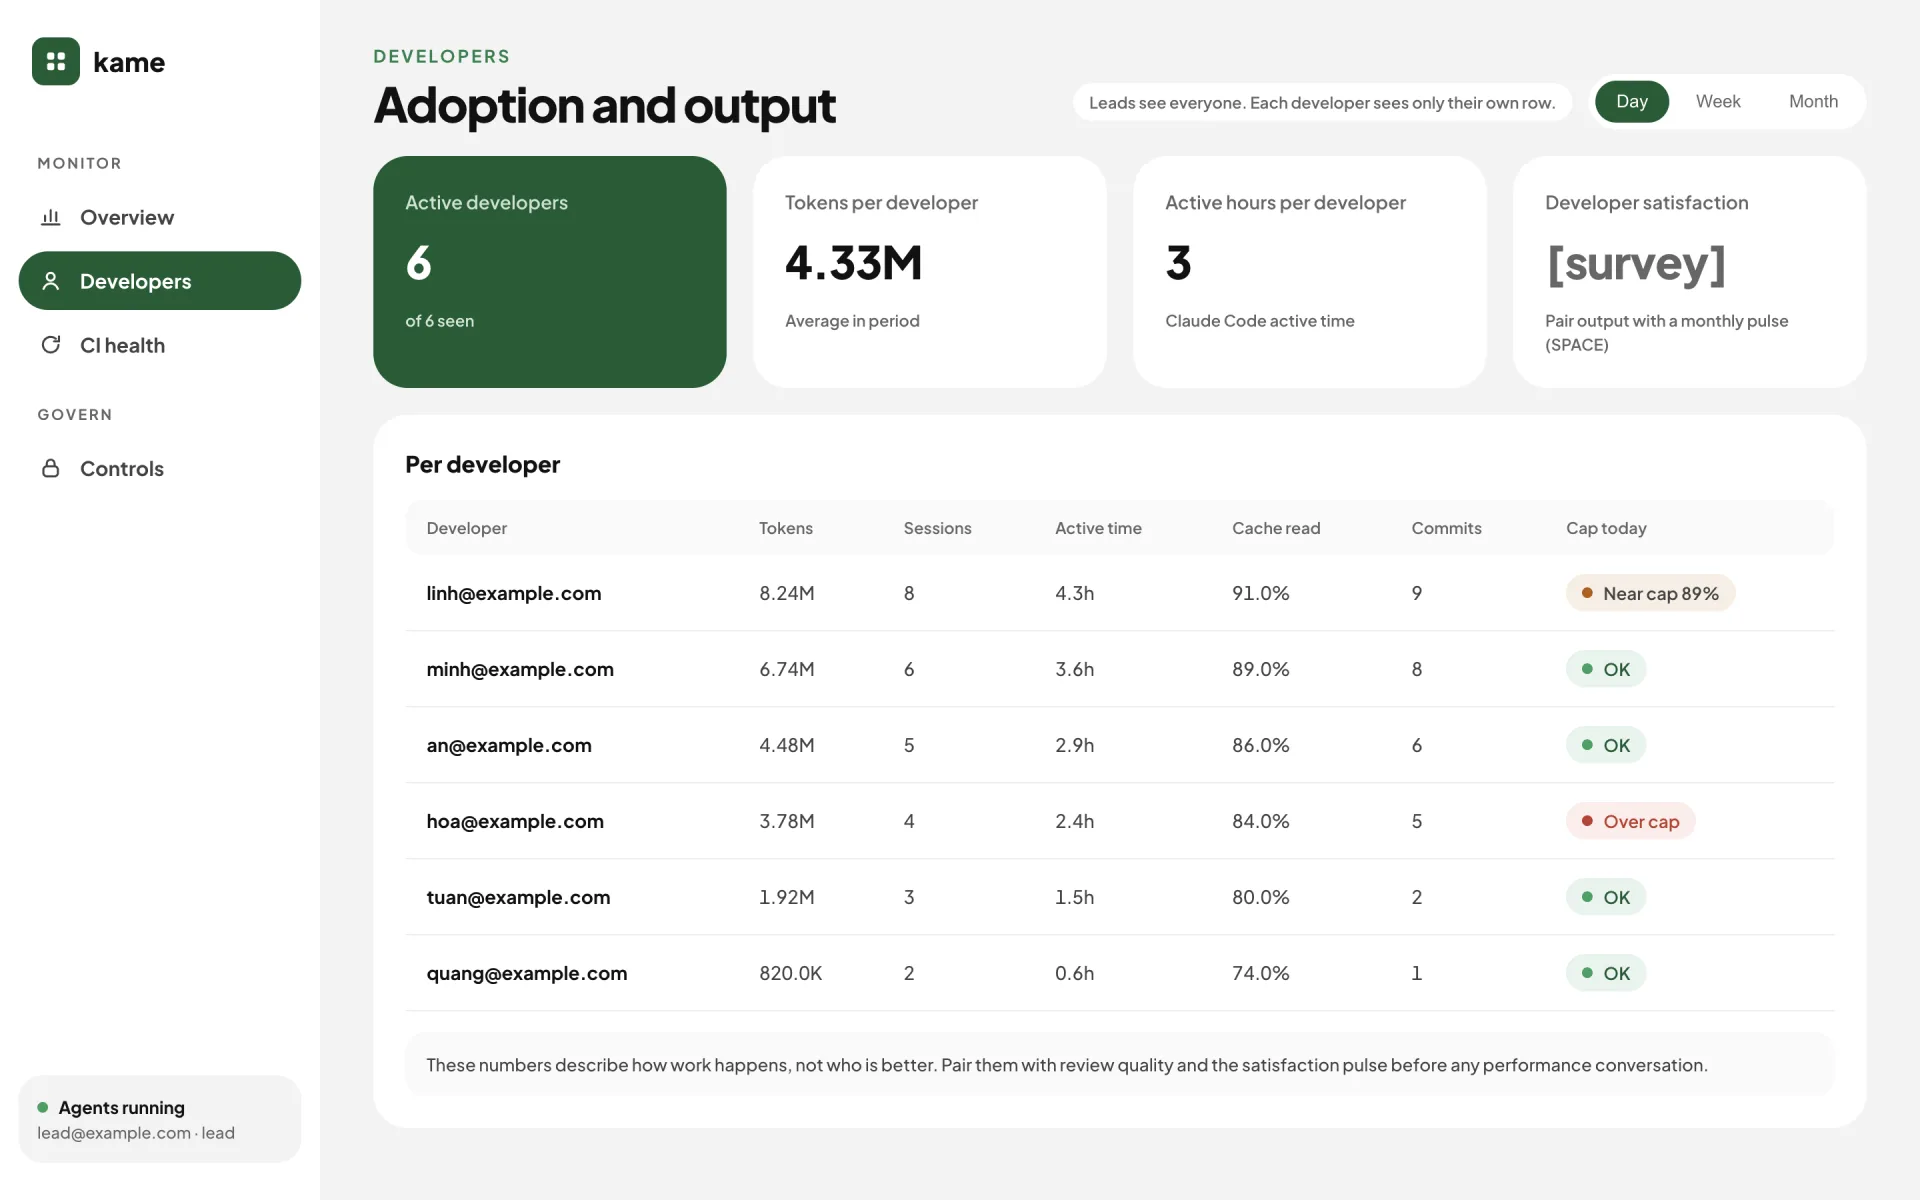
The Developers screen carries its own disclaimer, because the numbers invite misuse: these numbers describe how work happens, not who is better. The fourth card is a placeholder for a satisfaction pulse on purpose. Output without the developer’s own view is half a picture.
The numbers
Every claim below comes from a test I ran against the live system, not from the design.
| Check | Result |
|---|---|
| Token totals vs the CLI’s own count (one session, all token types) | 40,858 = 40,858, 0% difference |
| Off switch: admin command to first blocked prompt | ~1.3 s |
| Off switch in real sessions, two separate accounts | both blocked, both resumed when switched back on |
| Hook behaviour (switch, cap, routing, outage handling) | 16 of 16 scenarios pass |
| Spend alert at 50 / 80 / 100% | 3 mails, to the ops inbox only |
| CI failures vs GitHub, per repository | 9 of 9 match |
| Admin permission matrix (write needs admin token + bearer; read-only token refused) | 4 of 4 |
One number changed how I read everything else. For the heaviest user in the pilot, 96% of all tokens over a week were cache reads: the agent re-reading context it already had, once per turn. Output was under 1%. A light user with short sessions looked the opposite way round (71% cache writes, because every new session pays to build its context once). Either way, the lever that moves cost is the number and length of sessions and turns, not shorter prompts or shorter answers. The Overview card says that under the percentage.
Four rollout gotchas
None of these are in the setup guide. All four would have made the controls look installed while doing nothing.
- The plugin is not active on the first session. After a managed-settings change, the first session on a machine only downloads the plugin. The hooks act from the next session.
- Each seat must accept managed settings once, interactively. Until someone opens Claude Code in a terminal and accepts, headless runs apply the telemetry env but never install the plugin. A seat that only ever runs in CI never gets the off switch. CI has to load the plugin explicitly.
- Plugin updates are not automatic. A new version sat unused until
claude plugin updateran on each account. Every hook change needs a version bump and an update step in the runbook. - Managed settings are client-side. They are a strong default, not a lock. The only hard stop is a spend limit on the vendor side. The runbook says so in its first section.
What review caught
I ran two rounds of code review on the finished system. They found 13 real issues. Three are worth knowing if you build anything like this:
- Counter restarts double-count. OpenTelemetry sends running totals. When a session’s counter restarts, a naive “difference from the last value” either loses tokens or counts the same tokens again on every export. The fix keys each counter on its start time, which Claude Code sends and keeps stable within a session (I verified: a session exporting every 5 seconds added exactly its final total to the day, to the token).
- A read-only screen leaked other people’s numbers. Caps were hidden from non-leads, but the alert history on the same screen was not. Access rules belong on the server, per field, not per page.
- “Newest id seen” is the wrong cursor for CI. Run ids follow start time, not finish time, so a long run that finishes after a short newer one was skipped forever, and long runs are the expensive ones.
The honest limit
Usage numbers are self-reported. The telemetry comes from the developer’s machine, and the ingest credential has to live in every developer’s environment. A developer who wants to can post numbers under a colleague’s name. kame limits the damage (a single export counts at most 10M tokens toward a cap, and anything clipped shows on the Controls screen), but a patient fake stream still counts.
So the cap is a guard rail, not an audit trail. For billing-grade numbers, the source of truth is the vendor’s own usage data. I would say this in the first meeting, not the last.
What is next
Phase 2 covers what phase 1 could not measure yet: a weekly KPI mail, a shadow reviewer that comments on pull requests, and three screens (Verification, Risk, Incidents) that need data sources phase 1 does not have: review gates, change tiers and agent tool decisions. Lead time and time to restore stay as labelled placeholders until there is a deploy and incident source behind them.
Take-aways for a team lead
- Split the seven controls into “see” and “act” before you pick a tool. Dashboards cover seeing. Acting needs something inside the developer’s session, and that is where most of the rollout risk lives.
- Test the rollout, not just the feature. Every gotcha above made the controls look installed while they did nothing. Verify with a real session on a second account, with the switch off.
- Publish the limits with the dashboard. Self-reported usage, client-side settings and per-person metrics all need a sentence of context next to the number, or someone will draw the wrong conclusion from it.
Rolling out AI coding agents in your team and want this kind of control, or a second opinion on your setup? I help teams design and run AI-SDLC governance: telemetry, caps, guard rails and the rollout itself. Email me at [email protected].